Illuminating the Electronic Properties of WS2 Polytypism with Electron Microscopy
This is a summary highlighting the application of EELSFitter in this publication. For more detail about the work presented, please refer to the publication itself [van Heijst et al., 2021]
Abstract
Tailoring the specific stacking sequence (polytypes) of layered materials represents a powerful strategy to identify and design novel physical properties. While nanostructures built upon transition-metal dichalcogenides (TMDs) with either the 2H or 3R crystalline phases have been routinely studied, knowledge of TMD nanomaterials based on mixed 2H/3R polytypes is far more limited. In this work, mixed 2H/3R free-standing WS2 nanostructures displaying a flower-like configuration are fingerprinted by means of state-of-the-art transmission electron microscopy. Their rich variety of shape-morphology configurations is correlated with relevant local electronic properties such as edge, surface, and bulk plasmons. Machine learning is deployed to establish that the 2H/3R polytype displays an indirect band gap of \(E_{bg} = 1.6_{−0.2}^{+0.3}\) eV. Further, high resolution electron energy-loss spectroscopy reveals energy-gain peaks exhibiting a gain-to-loss ratio greater than unity, a property that can be exploited for cooling strategies of atomically-thin TMD nanostructures and devices built upon them. The findings of this work represent a stepping stone towards an improved understanding of TMD nanomaterials based on mixed crystalline phases.
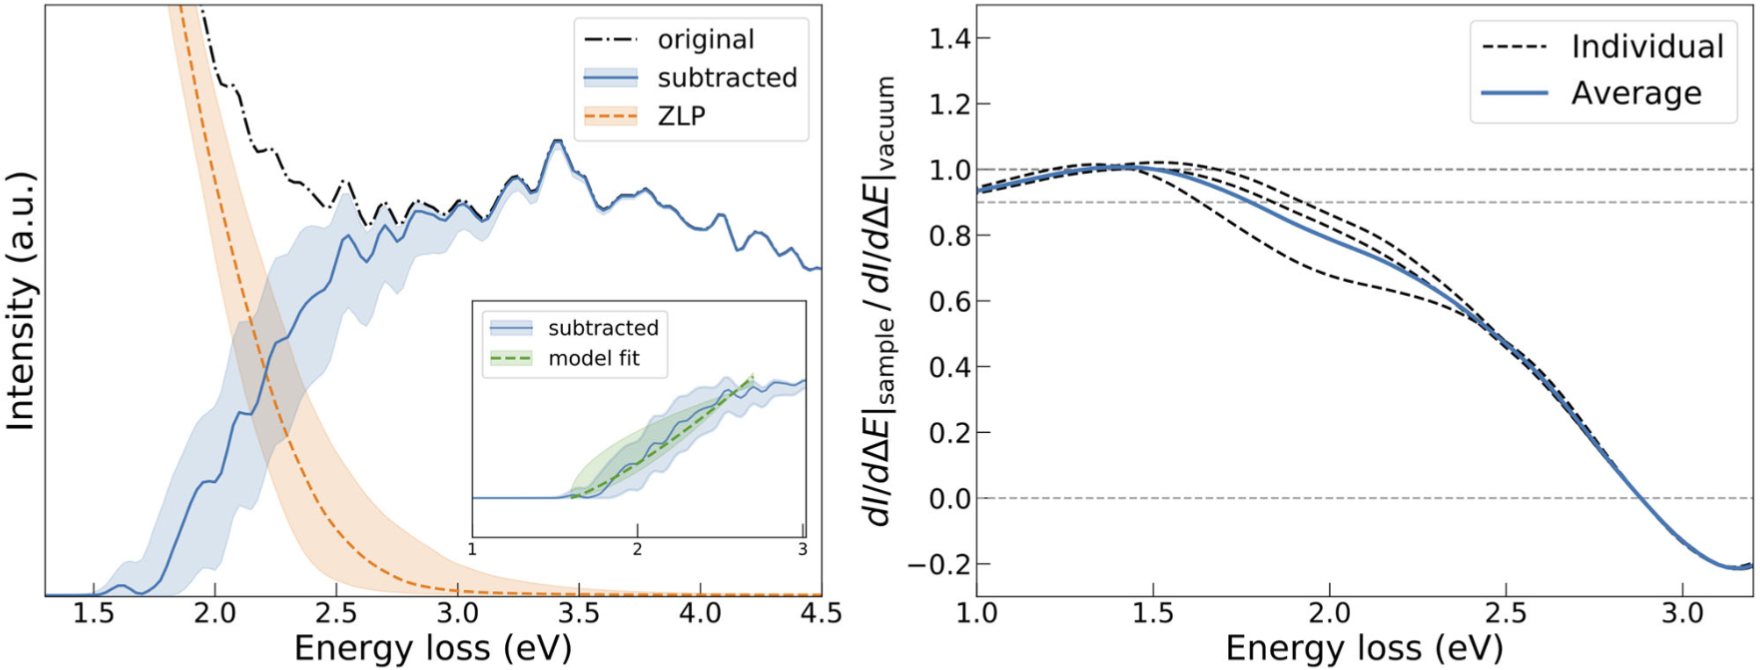
Fig. 8 a) The low-loss region of the original EEL spectrum recorded at the location indicated in Figure S8, Supporting Information, together with the resulting subtracted spectrum. The ZLP model prediction used for the subtraction procedure is also displayed. The inset shows the result of the polynomial fit to the onset region of the subtracted spectrum and the bands represent the 68% CL intervals for the model uncertainties. b) The ratio of the derivative of the original EELS intensity profile indicated in (a) over the average of the corresponding derivative for spectra recorded in the vacuum. The value of the energy loss for which this ratio differs from unity by more than 10% determines the training range of the machine learning model. Note that this ratio crosses the x-axis at the first local minimum of the unsubtracted spectrum.