Edge-induced excitations in Bi2Te3 from spatially-resolved electron energy-gain spectroscopy
This is a summary highlighting the application of EELSFitter in this publication. For more detail about the work presented, please refer to the publication itself [La et al., 2023]
Abstract
Among the many potential applications of topological insulator materials, their broad potential for the development of novel tunable plasmonics at THz and mid-infrared frequencies for quantum computing, terahertz detectors, and spintronic devices is particularly attractive. The required understanding of the intricate relationship between nanoscale crystal structure and the properties of the resulting plasmonic resonances remains, however, elusive for these materials. Specifically, edge- and surface-induced plasmonic resonances, and other collective excitations, are often buried beneath the continuum of electronic transitions, making it difficult to isolate and interpret these signals using techniques such as electron energy-loss spectroscopy (EELS). Here we focus on the experimentally clean energy-gain EELS region to characterise collective excitations in the topologically insulating material Bi2Te3 and correlate them with the underlying crystalline structure with nanoscale resolution. We identify with high significance the presence of a distinct energy-gain peak around -0.8 eV, with spatially-resolved maps revealing that its intensity is markedly enhanced at the edge regions of the specimen. findings illustrate the reach of energy-gain EELS analyses to accurately map collective excitations in quantum materials, a key asset in the quest towards new tunable plasmonic devices.
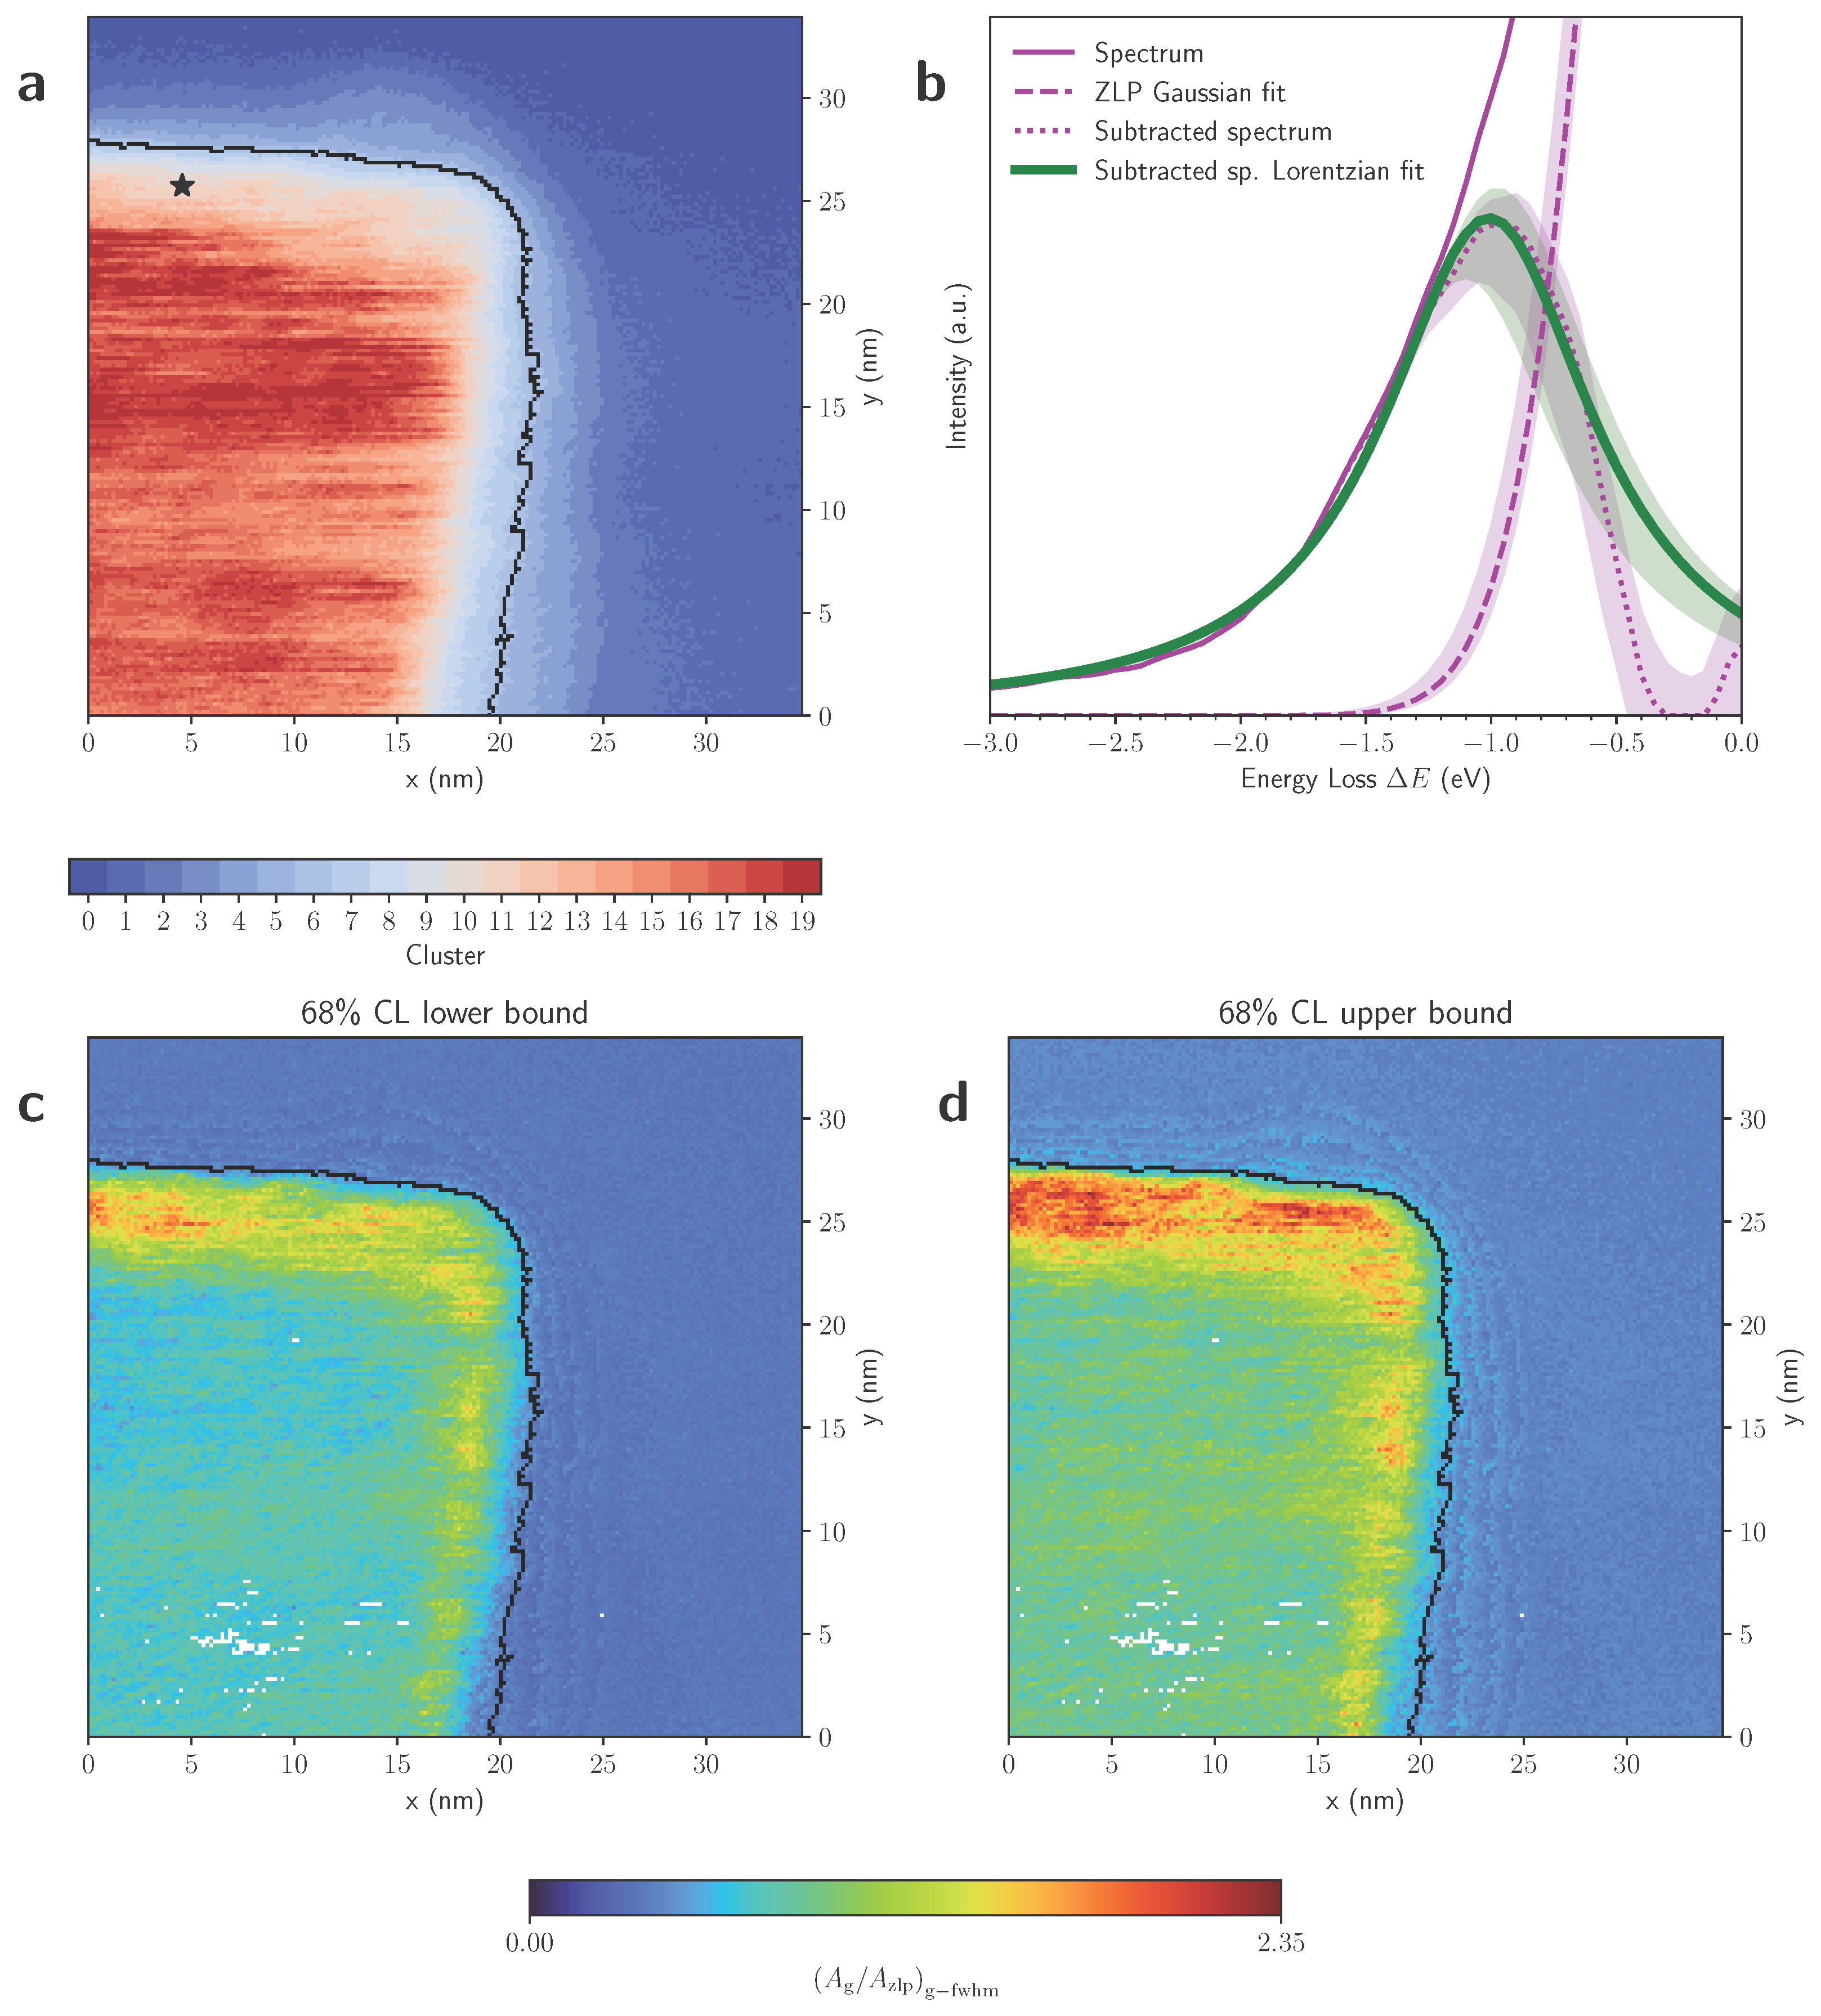
Fig. 11 Energy-gain peak characterisation with the Monte Carlo replica method. (a) The EELS spectral image of Fig. 1c classified into 20 clusters, each of them composed by pixels with similar thickness. (b) Same as Fig. 2b now using the Monte Carlo replica method to estimate and propagate the ZLP fitting model uncertainties. For the ZLP Gaussian fit, the subtracted spectrum, and the Lorentzian fit to the latter we display both the median over replicas and the 68% CL intervals. (c,d) Same as Fig. 3c now the lower and upper ranges, respectively, of the 68% CL interval for the area ratio evaluated over the Monte Carlo replicas.