Neural network training
Contents
Neural network training#
Here we present plots and animations displaying the training of the neural network on parton-level \(pp \rightarrow t\bar{t}\) pseudo-data. Details of the neural network architecture and settings are presented in Section 3.3 of [Gomez Ambrosio et al., 2022] .
Overview#
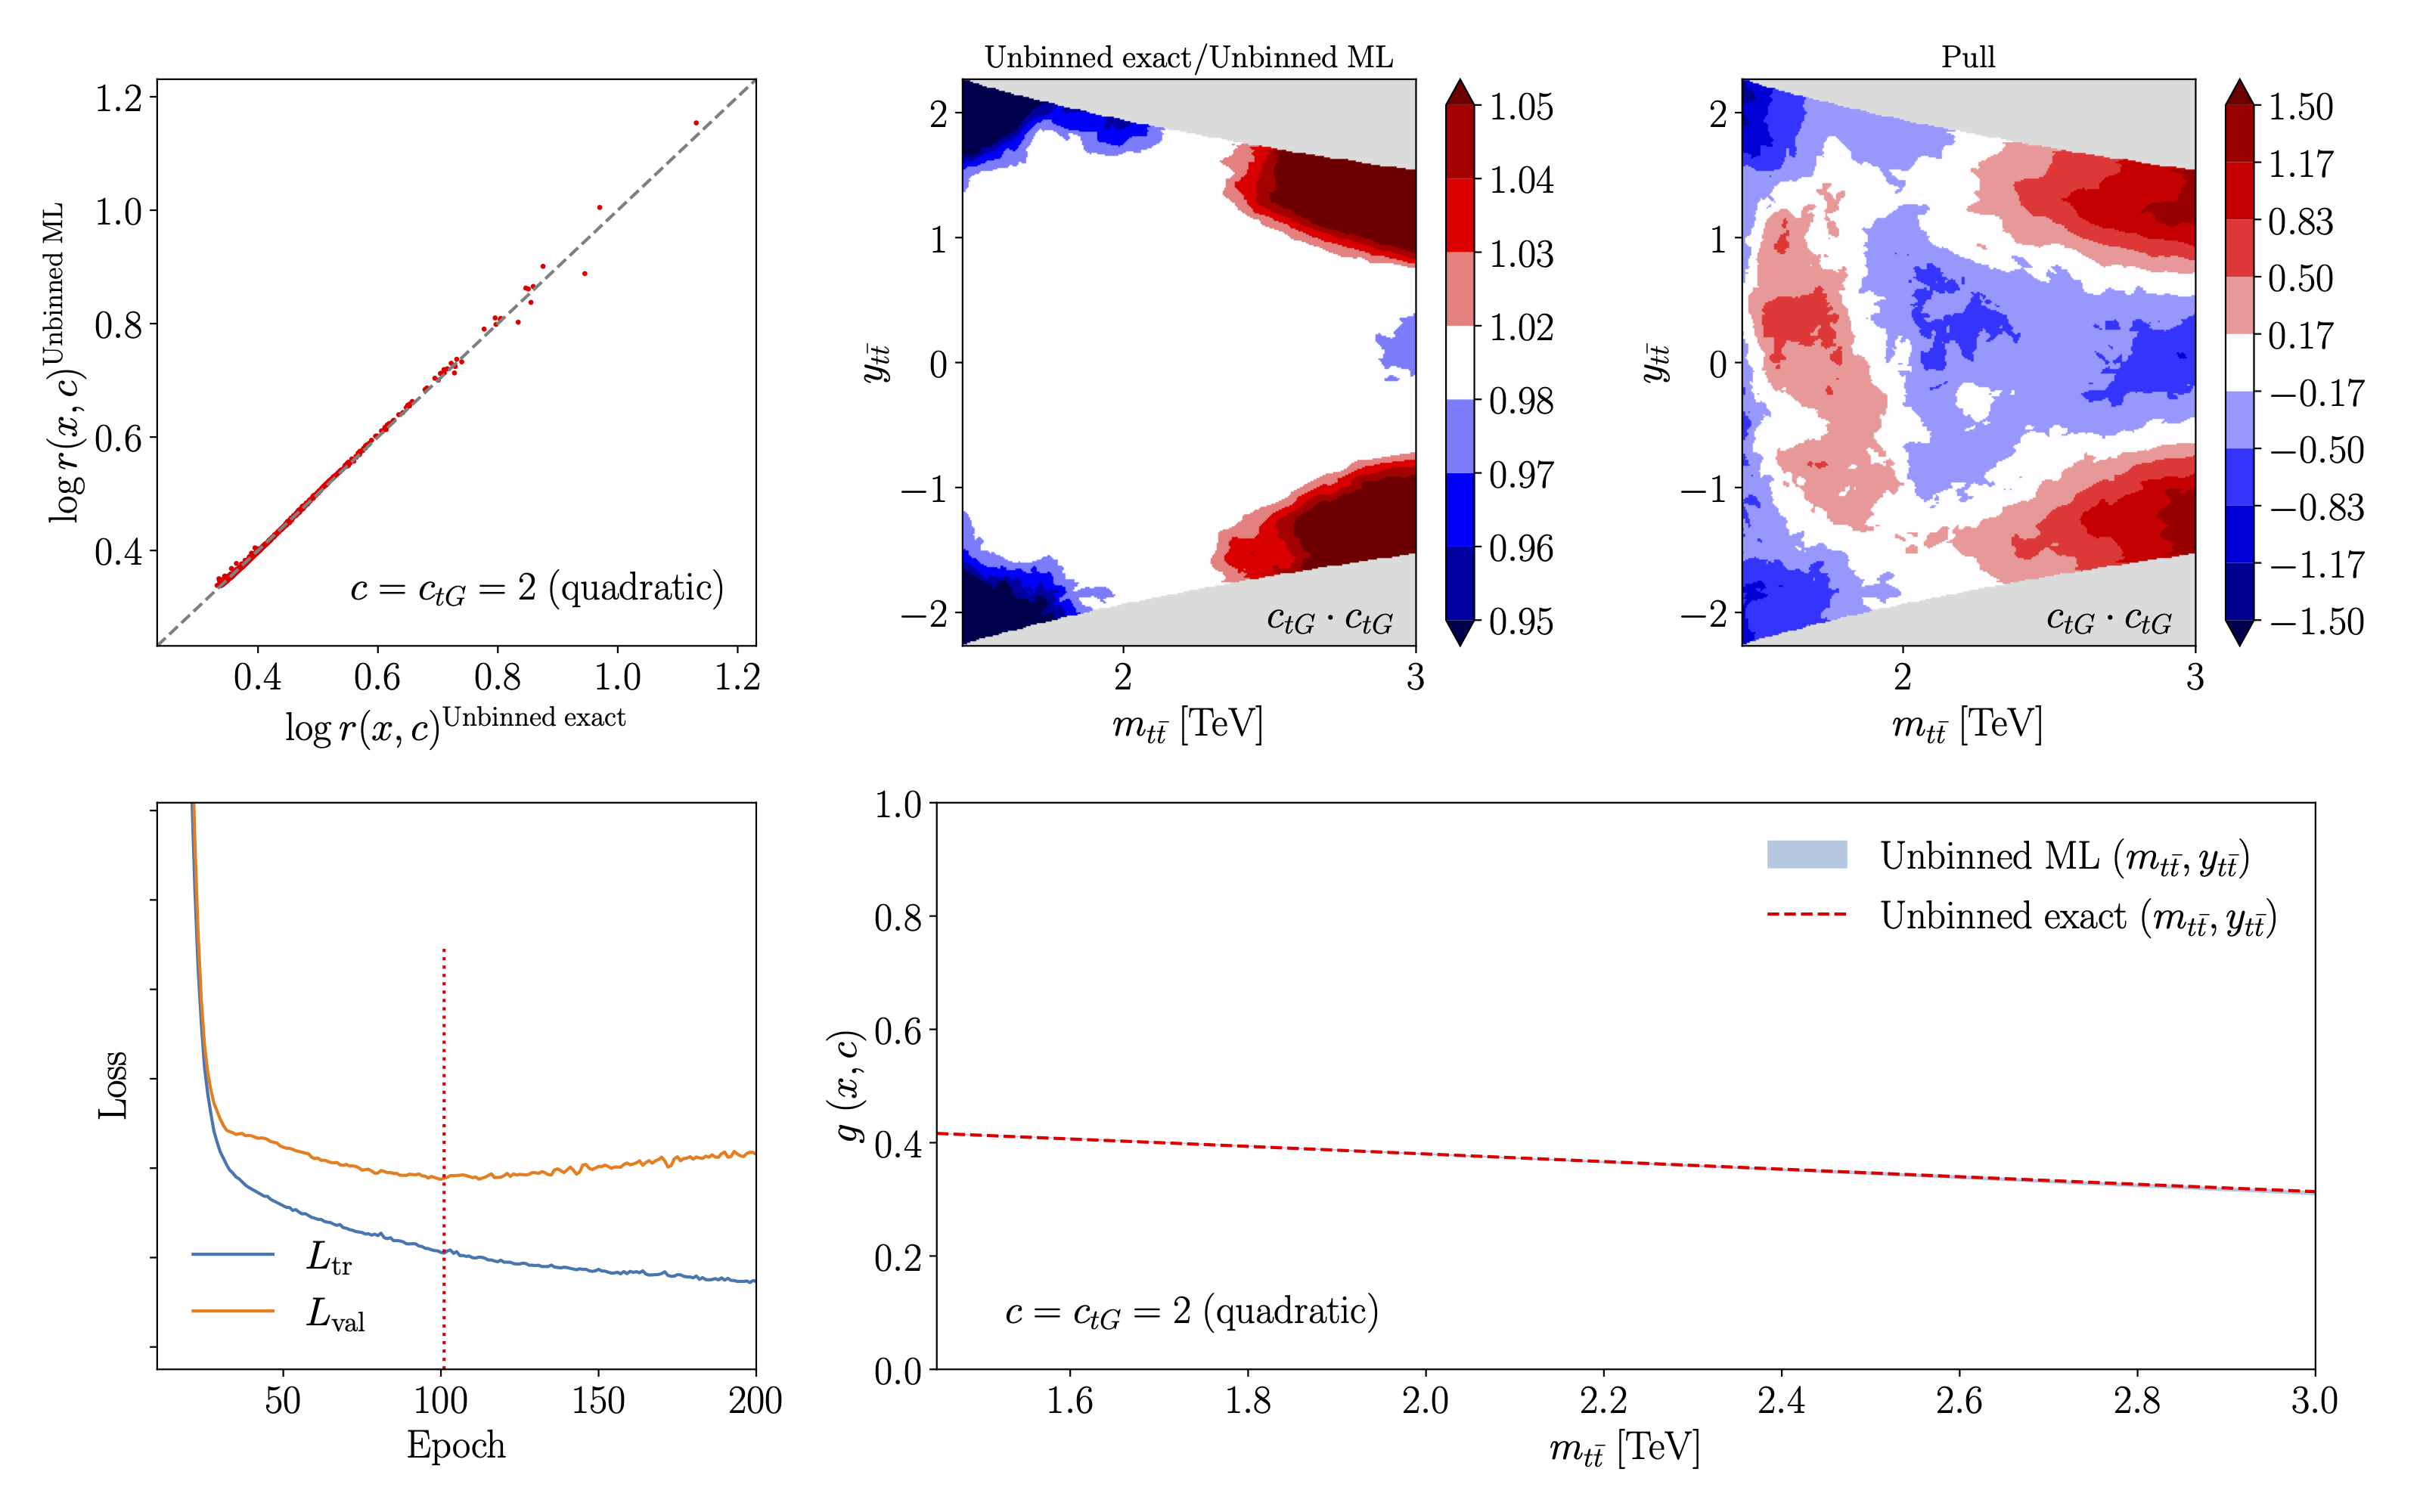
First, we present an overview of the training of the neural network associated to the quadratic contribution of the chromomagnetic operator \(C_{tG}\), trained on two features, \(m_{t \bar{t}}\) and \(y_{t \bar{t}}\).
From left to right and top to bottom we display:
a point-by-point comparison of the log-likelihood ratio in the ML model and the corresponding analytical calculation;
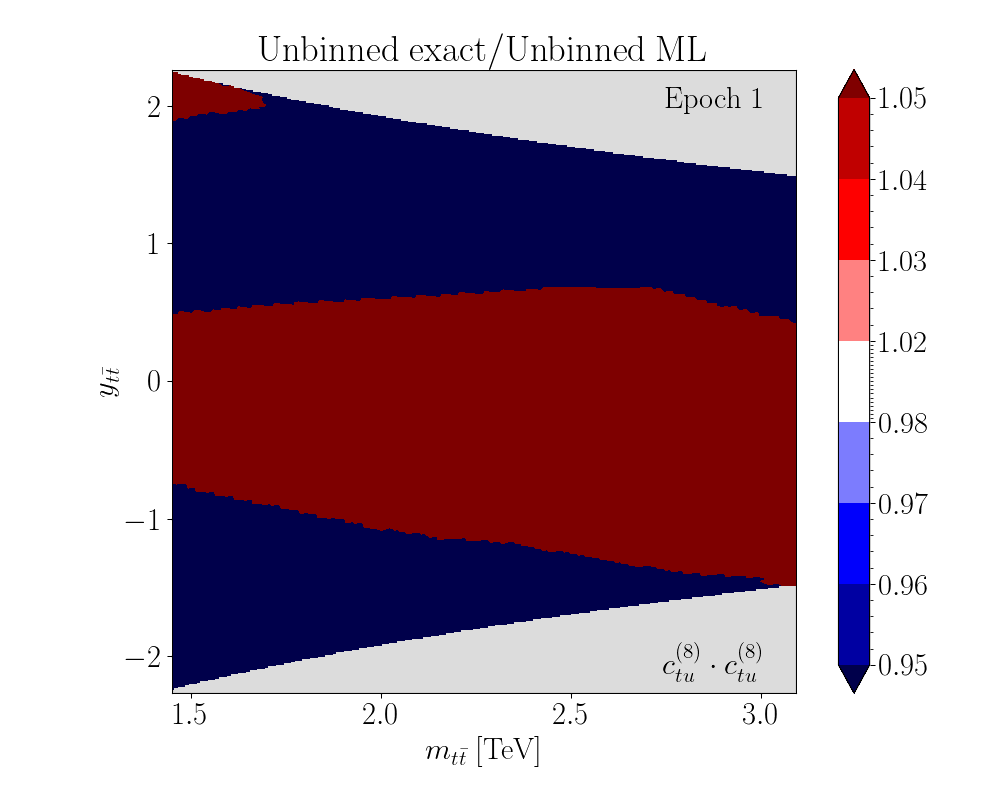
the median of the ratio between the ML model and the analytical calculation and the associated pull in the \((m_{t \bar{t}}, y_{t \bar{t}})\) feature space;
the evolution of the loss function split in training and validation sets for a representative replica as a function of the number of training epochs;
the resultant decision boundary \(g(x,c)\) for \(c_{tG} = 2\) including MC replica uncertainties, at the end of the training procedure.
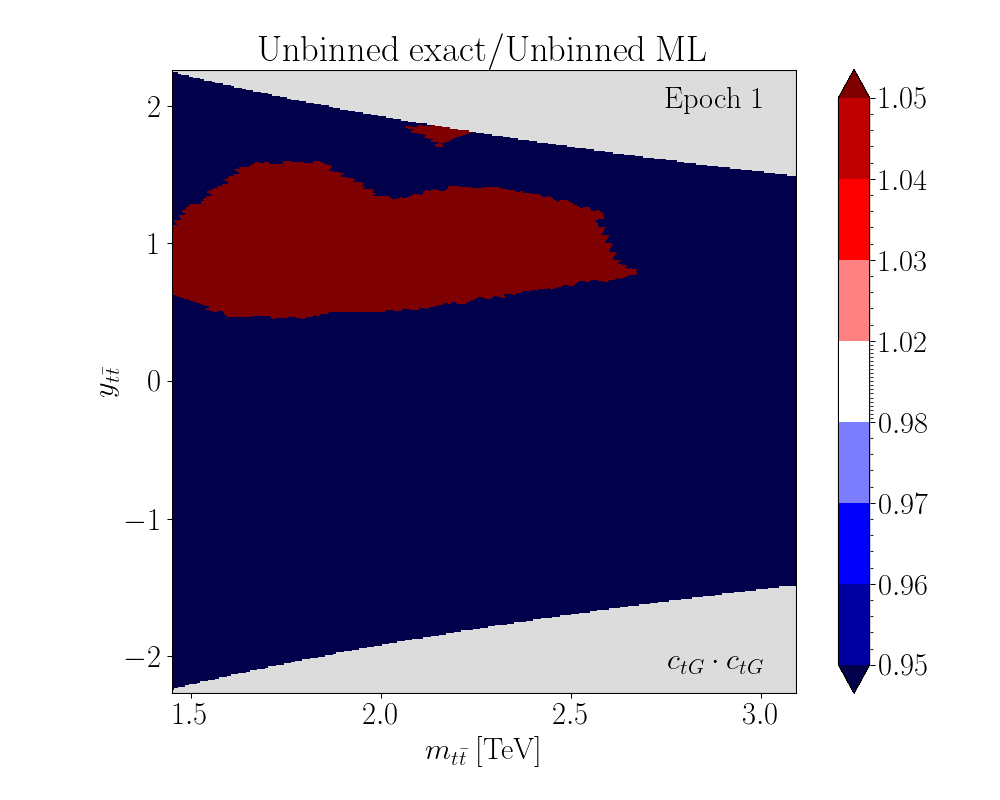
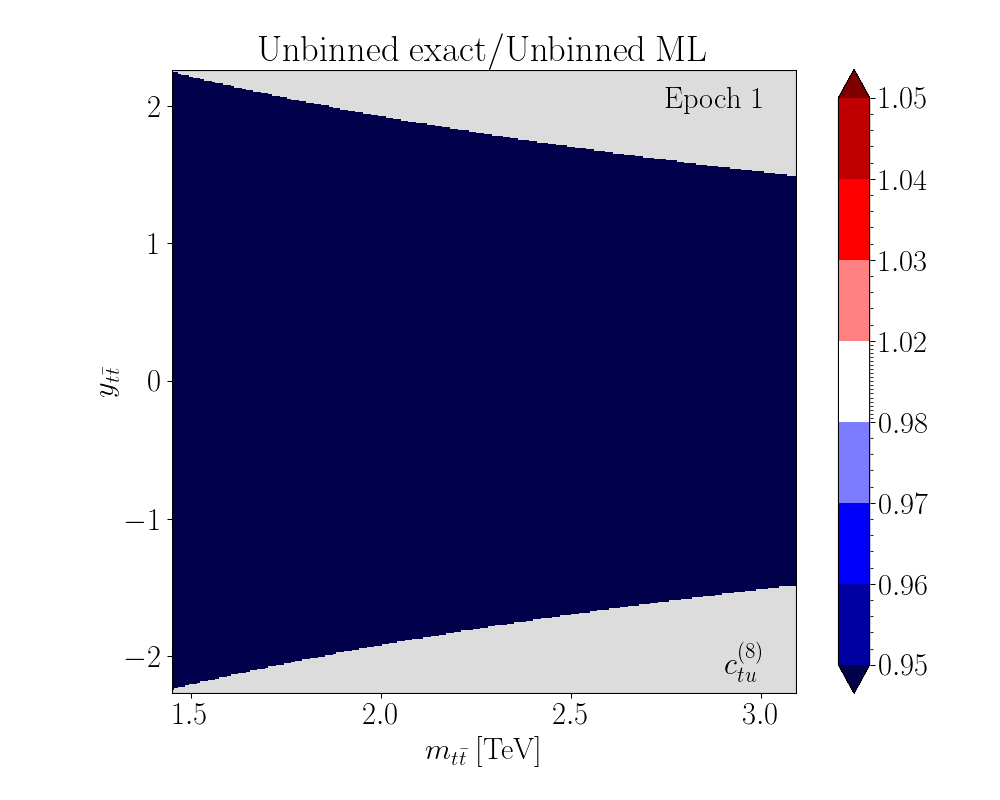
Animations of the progression of the exact/ML model comparison with training#
The following animations show the evolution of the median of the ratio between the ML model and the analytical calculation in the \((m_{t \bar{t}}, y_{t \bar{t}})\) feature space with the neural network training.

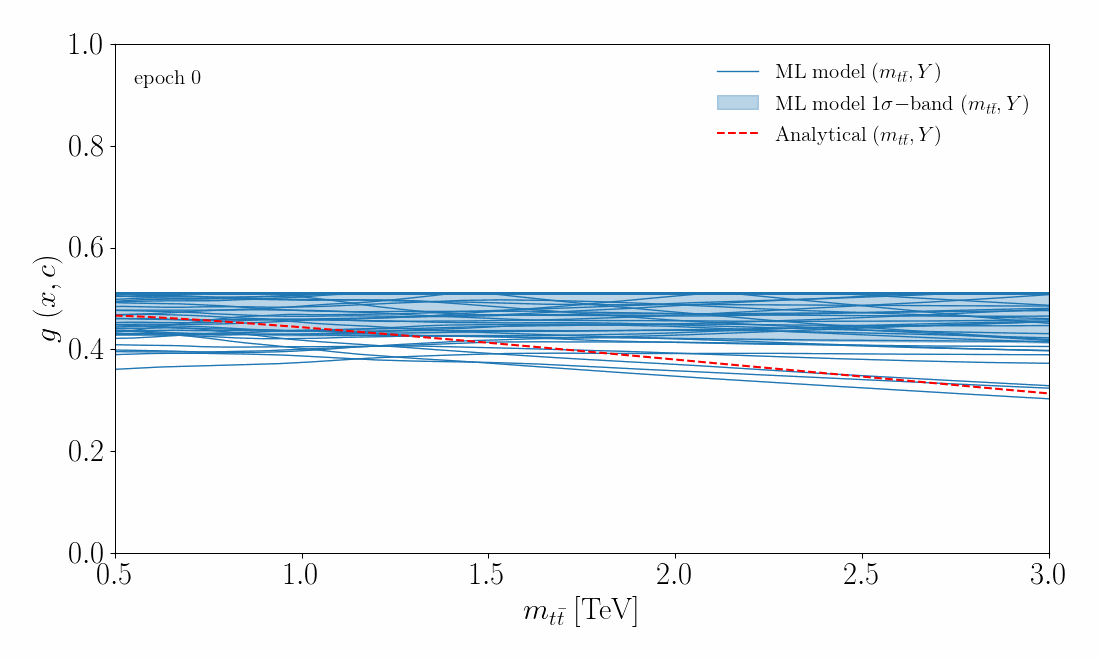
Animation of the training of the decision boundary function#
The following animation shows the evolution of the per-replica decision boundary function \(g(x,c)\) along \(y_{t\bar{t}}=0\). The uncertainty on \(g(x,c)\) is obtained from the spread of replicas. We compare this to the exact calculation of \(g(x,c)\), shown in red. Excellent agreement between the neural network and exact calculation is found.